
After we published our recent RedisGraph benchmarking results, the folks at TigerGraph replied with some thoughts. While we appreciate hearing our competition’s perspective, we’d like to address their accusation of fake news.
In our blog post, we introduced a parallel requests benchmark. This test is the same K-hop neighborhood count query test created by TigerGraph, but for our test, we had 22 clients execute the queries against RedisGraph concurrently. We introduced the concurrent requests test because we believe it is representative of almost any real-time, real-world scenario.
The results we published measured the overall benchmark time of 300 seeds for RedisGraph. This is the time it took from submitting the first query until the last query returned. For TigerGraph however, we extrapolated the overall benchmark time instead of executing the benchmark. We wrongly assumed that in this concurrent test it could be seen as if the requests were executed sequentially in TigerGraph, since we observed that certain queries in TigerGraph consumed all 32 cores of the machine. The overall benchmark time results that we first published for TigerGraph were based on the average query time that TigerGraph had published multiplied by the total number of seeds.
We acknowledge this was an unfair assumption, so we decided to execute the full benchmark against TigerGraph.
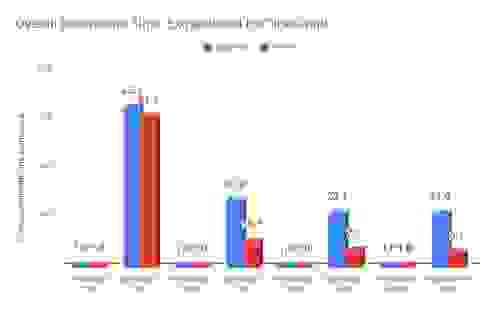
For your convenience, below are the results we originally published. The times presented below are overall benchmark times (for RedisGraph these were measured, for TigerGraph they were extrapolated as described above).
| One-hop | Two-hop | Three-hop | Six-hop | ||||||
|---|---|---|---|---|---|---|---|---|---|
| Data Set | Measure | RedisGraph | Tiger | RedisGraph | Tiger | RedisGraph | Tiger | RedisGraph | Tiger |
| graph500 | time (msec) | 29 | 1,890 | 772 | 21,000 | 5,554 | 123,000 | 24,388 | 534,000 |
| normalized | 1 | 65.2 | 1 | 27.2 | 1 | 22.1 | 1 | 21.9 | |
| time (msec) | 117 | 7,200 | 12,923 | 138,000 | 286,018 | 2,019,000 | 3,117,964 | 18,900,000 | |
| normalized | 1 | 61.5 | 1 | 10.7 | 1 | 7.1 | 1 | 6.1 | |
The numbers below represent the overall benchmark time we recently measured for TigerGraph.
| One-hop | Two-hop | Three-hop | Six-hop | ||||||
|---|---|---|---|---|---|---|---|---|---|
| Data Set | Measure | RedisGraph | Tiger | RedisGraph | Tiger | RedisGraph | Tiger | RedisGraph | Tiger |
| graph500 | time (msec) | 29 | 153 | 772 | 12,038 | 5,554 | 78,436 | 24,388 | 323,262 |
| normalized | 1 | 5.3 | 1 | 15.6 | 1 | 14.1 | 1 | 13.3 | |
| time (msec) | 117 | 979 | 12,923 | 72,460 | 286,018 | 1,556,425 | 3,117,964 | 14,864,898 | |
| normalized | 1 | 8.4 | 1 | 5.6 | 1 | 5.4 | 1 | 4.8 | |
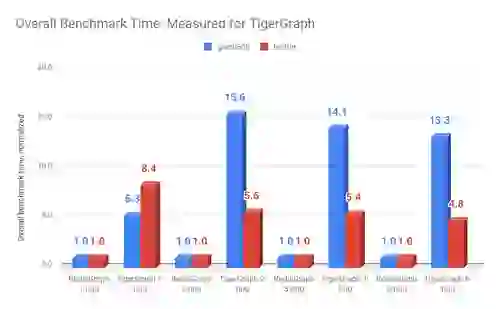
While we found that RedisGraph is still faster than TigerGraph, this new data finds that we are 5-15 times faster (as opposed to the 6-65x estimate we originally published). The biggest change was in the 1-hop queries, whereas for longer path queries the times decreased slightly. This is due to the fact that 1-hop queries are far less computationally expensive than multiple hop queries, allowing for more concurrency. But to quote TigerGraph: “In the real world, if you only need to do one hop, a key-value database or RDBMS is sufficient enough; you don’t need a graph product.”
In addition to the overall benchmark time, we would also like to publish the average query time from our parallel request benchmark, since overall benchmark time is in fact not the best metric for this test. This is because the population of seeds (300) was too small for 22 parallel requests. If, for example, the longest running query was submitted as the last query, then the other 21 clients would be idle, which would influence overall benchmark time negatively.
A more correct metric is average query time, which averages the individual response times of all 300 seeds. Ideally, we would not include the first 22 and last 22 response times in this average, but since the population of seeds is already so small, we chose to leave them in. Below are the average query times we measured for both RedisGraph and TigerGraph. These are new results that weren’t included in our first benchmark publication, and we used no extrapolation to determine the time results below.
| One-hop | Two-hop | Three-hop | Six-hop | ||||||
|---|---|---|---|---|---|---|---|---|---|
| Data Set | Measure | RedisGraph | Tiger | RedisGraph | Tiger | RedisGraph | Tiger | RedisGraph | Tiger |
| graph500 | time (msec) | 0.6 | 10 | 43 | 861 | 349 | 5,550 | 1,614 | 23,143 |
| normalized | 1 | 16.1 | 1 | 20.2 | 1 | 15.9 | 1 | 14.3 | |
| time (msec) | 8 | 53 | 711 | 4,834 | 20,269 | 107,704 | 224,539 | 1,069,360 | |
| normalized | 1 | 6.9 | 1 | 6.8 | 1 | 5.3 | 1 | 4.8 | |
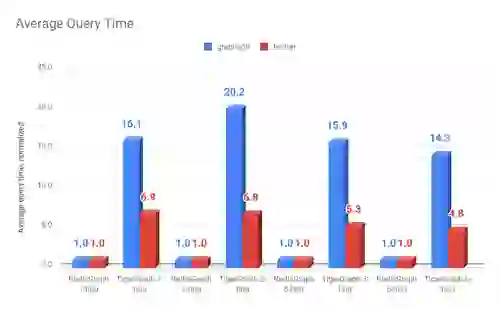
This shows that RedisGraph’s average query times are 5-20 times faster than TigerGraph under parallel load. We believe this is what really matters for our RedisGraph users — a database that enables the highest throughput at the lowest latency.
Furthermore, we’re making our modifications to the benchmarking code originally created by TigerGraph available to everyone and documenting a known issue about our variable length path query behaviour. We would also like to confirm that any results published in our original blog post that were not for TigerGraph or RedisGraph were the results that TigerGraph originally published — no boosters were given. And yes, in addition to RedisGraph, TigerGraph was another solution that never timed out in any test.