As you’d expect, real-time vehicle tracking is no child’s play. From start to finish, there’s a whole range of variables that you have to consider before the benefits of real-time vehicle tracking come to fruition. Arguably, the most important factor is speed. Any communication lag will substantially produce stale data, and the staler it gets, the less valuable it becomes.
It’s a complex operation, yet this Redis Launchpad app made it work, combining Redis and Golang for their ability to extract data with hyper-efficiency and accuracy. This ensured that users got the most value out of vehicle tracking.
Let’s take a look at how it was done. (We’d also like to point out the wide variety of exciting apps in our Redis Launchpad for you to get started with, regardless of your preferred frameworks and languages.)
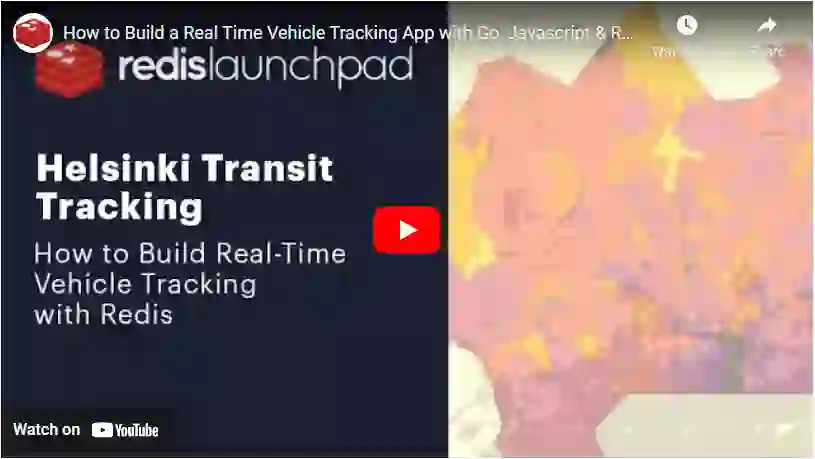
Let’s look at how to create a reliable and powerful real-time vehicle tracking system with Redis. We’ll uncover how Redis was used to create a real-time tracking system in Helsinki to publish real-time locations of buses on a web UI.
Given that HSL publishes on the order of ~50 million updates per day, Redis was the preferred tool due to the robustness of the RedisTimeSeries module. It was capable of quickly aggregating tens of thousands of data points.

Using this application, users were able to gather real-time information about each bus, including its location, historical positions, and current speed.

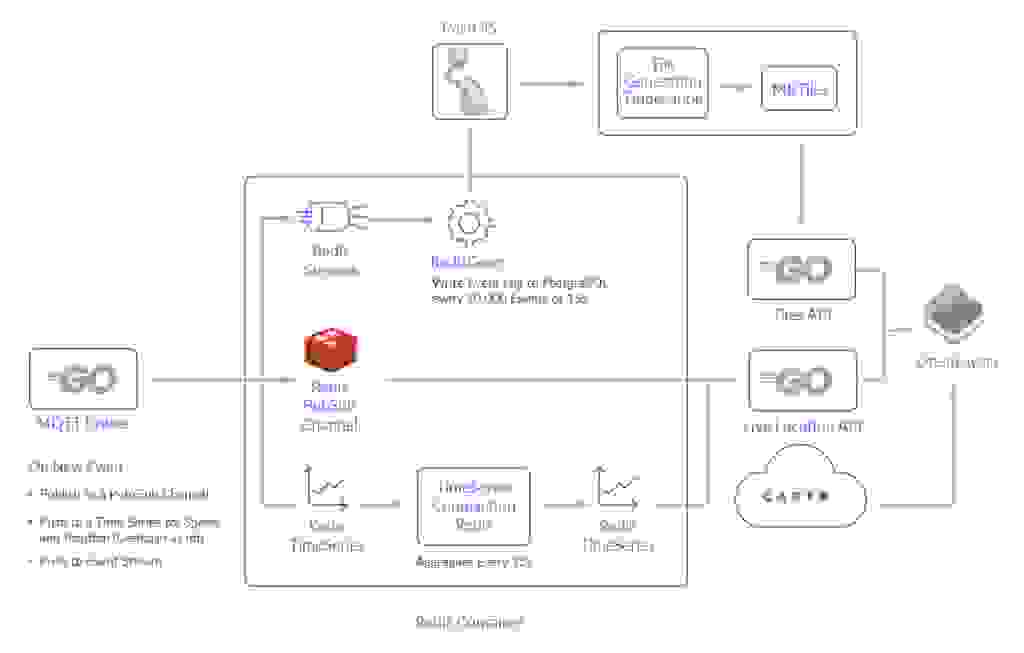
Let’s analyze each component, unpacking its functionality along with the steps required for its implementation. Below is an overview of the system components that you’ll need:
To tie everything together and give you a clear visualization of how each feature was implemented, here’s a quick summary of how everything flows chronologically.
# Topic - Delivered as Msg Part 1
/hfp/v2/journey/ongoing/vp/bus/0018/00423/2159/2/Matinkylä (M)/09:32/2442201/3/60;24/16/58/67

# Body - Delivered as Msg Part 2
{
  "VP": {
    "desi": "159",
    "dir": "2",
    "oper": 6,
    "veh": 423,
    "tst": "2021-05-15T06:40:28.629Z",
    "tsi": 1621060828,
    "spd": 21.71,
    "hdg": 67,
    "lat": 60.156949,
    "long": 24.687111,
    "acc": 0,
    "dl": -21,
    "odo": null,
    "drst": null,
    "oday": "2021-05-15",
    "jrn": 202,
    "line": 1062,
    "start": "09:32",
    "loc": "GPS",
    "stop": null,
    "route": "2159",
    "occu": 0
  }
}
Before we look into the nuts and bolts of the architecture, it’s important to highlight that all components were hosted on single AWS t3.medium with a GP3 EBS volume. Although the t3.medium was appealing because of burstable CPU, a smaller instance could handle the application in its current state.
The GoLang broker was used to process incoming messages from Helsinki into Redis. Once processed by GoLang, the messages are sent to a number of different locations:
Event data sent to Redis Streams is then processed with a RedisGears function and written to persistent storage (PostgreSQL).
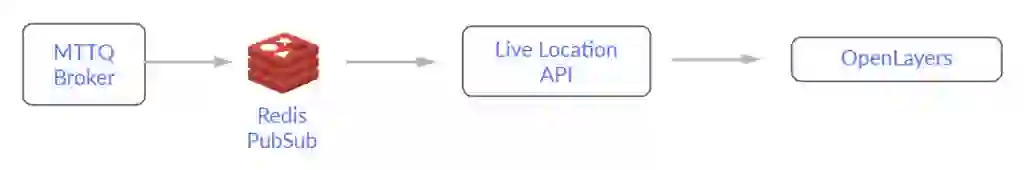
Event data is published by GoLang and sent to Redis PubSub which is then sent to each connected client via Web socket. This provides live updates of positions in the browser on the live-location layer.
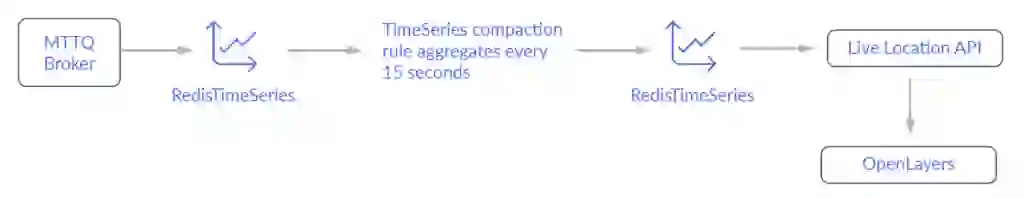
The current speed and location of each bus was recorded via RedisTimeSeries. Time Series data was divided into different series for position (GeoHash) and speed for each scheduled trip. After every 15 seconds, these recordings were standardised using a compaction rule to avoid storing different intervals of data for any given trip.
Prerequisites:
Clone the repository:
git clone https://github.com/redis-developer/expert-garbanzo
Building the application:
A functional version of the system can be spun up locally with docker-compose.
docker-compose up --build
The above command will spin up (almost) all services required to run a local demo in their own isolated environments.
Open the browser and access the application using http://localhost:8080/.
The following command can be run if you’re interested in receiving periodic updates to the traffic speeds/neighborhoods layer. This is not absolutely necessary as it can take several hours to gather enough data to get a reasonable amount of data (and you’d still need to wait for the tilegen job to come around to repopulate layers).
docker exec <name of redis container> \
    bash -c "gears-cli run /redis/stream_writebehind.py --requirements /redis/requirements.txt"
The Redis PubSub channel is used for live locations. It’s relatively simple: the broker publishes an event to the Redis PubSub channel, then the live location API subscribes to the same message. When a client connects, they receive the same data passed through the web socket. The MQTT broker uses Golang as a Redis client and also utilizes the code below:
// In Golang...
pipe := client.TxPipeline()
ctx := client.Context()

// Stylizing the Actual Message Body for Readme
msg := &hsl.EventHolder{
    "acc": 0.1, "speed": 10.6, "route": "foo"
}

pipe.Publish(
    ctx, "currentLocationsPS", msg
)
# Using a standard Redis client...
127.0.0.1:6379>  PUBLISH currentLocationsPS '{"acc": 0.1, "speed": 10.6, "route": "foo"}'
The incoming event is pushed to Redis Streams. It’s then cleared and processed by a code that runs through RedisGears. This is written using the Redis Go Client below:
// In Golang...
pipe.XAdd(
    ctx, &redis.XAddArgs{
        Stream: "events",
        Values: []interface{}{
            "jid", journeyID,
            "lat", e.VP.Lat,
            "lng", e.VP.Lng,
            "time", e.VP.Timestamp,
            "spd", e.VP.Spd,
            "acc", e.VP.Acc,
            "dl", e.VP.DeltaToSchedule,
        },
    },
)
# Using a standard Redis client...
127.0.0.1:6379>  XADD events * jid journeyhashID lat 60 lng 25 time 1620533624765 speed 10 acc 0.1 dl "00:00"
The current speed and location of each bus trip were recorded in a RedisTimeSeries. A unique identifier was created for each “trip” (a JourneyHash), hashing certain attributes from the event. Just to clarify, the broker creates a time series for both speed and location for each JourneyHash.
What’s important to note is that the position and speed series have a short retention and are compacted to a secondary time series. This compacted series has a much longer retention time (~2hr) and is used by the API to show users the trip history layer. By being able to aggregate individual events efficiently, this pattern allows us to mitigate memory usage.
Commands
The commands are executed using Golang. First, check whether a JourneyHash has yet to be seen. You can do this by checking its inclusion in a set (journeyID). If the following returns 1,continue with creating series and rules, or else just TS.ADD the data.
SADD journeyID <JOURNEYHASH>
The first series is created with the following command. To simplify things, I will refer to these as Time Series A.
127.0.0.1:6379>  TS.CREATE positions:<JOURNEYHASH>:speed
127.0.0.1:6379>  TS.CREATE positions:<JOURNEYHASH>:gh
The aggregation series are fed by the “main” timeseries and are created with the command below. Again, to simplify things, I’ll refer to these as Time Series B.
127.0.0.1:6379>  TS.CREATE positions:<JOURNEYHASH>:speed:agg RETENTION 7200000 LABELS speed 1 journey <JOURNEYHASH>
127.0.0.1:6379>  TS.CREATE positions:<JOURNEYHASH>:gh:agg RETENTION 7200000 LABELS gh 1 journey <JOURNEYHASH>
For the rule that governs Time Series A -> Time Series B, you can use the following command:
127.0.0.1:6379> TS.CREATERULE positions:<JOURNEYHASH>:speed positions:<JOURNEYHASH>:speed:agg AGGREGATION LAST 150000
127.0.0.1:6379> TS.CREATERULE positions:<JOURNEYHASH>:gh positions:<JOURNEYHASH>:gh:agg AGGREGATION LAST 150000
If you want to add data to TimeSeries A, use the following:
127.0.0.1:6379> TS.ADD positions:<JOURNEYHASH>:speed * 10 RETENTION 60000 CHUNK_SIZE 16 ON_DUPLICATE LAST
127.0.0.1:6379> TS.ADD positions:<JOURNEYHASH>:gh * 123456123456163 RETENTION 60000 ON_DUPLICATE LAST
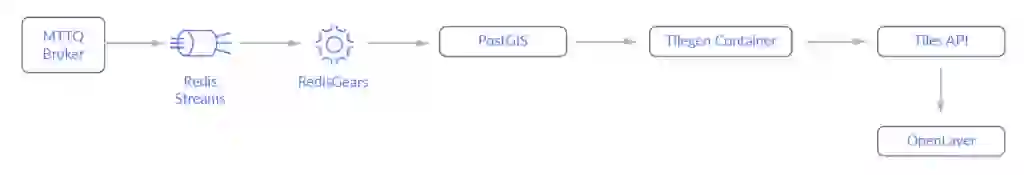
The redislabs/redismod is a Docker image that contains all of the essential Redis Modules. This was used as the base image for this project. From a stream, this function writes data to PostgreSQL/PostGIS every 5s/10,000 events. Despite Gears running off the main thread, this component is designed to do minimal data processing.
Its main purpose is to dump MQTT data into PostGIS and allows the PostGIS and TileGen processes to transform these events to MBtiles.
You should also know that the RedisGears function is written in Python and doesn’t call any Redis commands.
The PostGIS and TileGen containers are fundamental to serving GTFS and current traffic layers. Just to highlight, PostGIS is a PostgreSQL extension that enables geospatial operations.
TileGen is an Alpine container that contains two common utilities used in geospatial processing, GDAL and tippecanoe (and psql, the PostgreSQL client). This container is required for:
The TilesAPI is a simple Golang API which is used to fetch those tiles from disk and send them to the frontend.
There are two endpoints in the Locations API: /locations/ and /histlocations/.
Commands
The /locations/ endpoint subscribes/reads data from the PUB/SUB channel defined in the MQTT broker section. While written in Go, the redis-cli command for this would be:
127.0.0.1:6379> SUBSCRIBE currentLocationsPS
The /histlocations/ endpoint needs to gather data from multiple time series to create a combined response for the client. This means making a TS.MRANGE call. Because each Timeseries B is labelled with its JourneyHash, the TS.MRANGE gathers the position and speed stats with a single call, filtering on JourneyHash.
127.0.0.1:6379> TS.MRANGE - + FILTER journey=<JOURNEYHASH>
Frontend (OpenLayers)
The frontend uses a JS library called OpenLayers. This is used to create a map and display the layers that were created by previous described services. In production, this is served using Nginx rather than Parcel’s development mode.
The frontend also makes calls to a publicly available API for basemap imagery.
Technical Appendix
Data Throughput
It’s important to underline that this system was not specifically created to handle huge amounts of data. Despite this, it performed competently given this (relatively small scale) task.
Based on anecdotes, the system processed ~15GB of messages per day when subscribed to the MQTT topic corresponding to all bus position updates. Below, we have some charts to illustrate the rise in event throughput that occurred on a Sunday morning into afternoon and evening.
If you look closely, you’ll notice that towards the middle of the day the events/second hit the highest level at 500/s. This is after growing gradually from <10 events early in the morning.

However, on a weekday morning at 8am we can see the system handling ~1600+ events/s with ease. Below are some stats from a five minute window on the morning of 5/14/2021.
select
    now(), -- UTC
    count(1)/300 as eps -- averaged over prev 300s
from statistics.events
where approx_event_time > now() - interval'5 minute';


              now              | eps
-------------------------------+------
 2021-05-14 05:06:28.974982+00 | 1646
Memory, CPU, and Disk Usage
In local testing, it was originally suspected the CPU would be the most stressed part of the system. As things turned out, it was actually the disk. Below is a capture for the docker stats from 8am on 5/14/2021.
CONTAINER ID   NAME                     CPU %     MEM USAGE / LIMIT     MEM %     NET I/O
6d0a1d7fab0d   redis_hackathon_mqtt_1   24.02%    10.71MiB / 3.786GiB   0.28%     32GB / 60.4GB
833aab4d39a8   redis_hackathon_redis_1  7.02%     862.7MiB / 3.786GiB   22.26%    58.8GB / 38.9GB
By upgrading from AWS standard gp2 EBS to gp3,we were able to get 3000 IOPs and 125MB/s throughput for free, which made hosting the PostgreSQL instance in a container viable. Despite not having a robust disk, the site was still functional but this came at a cost—tile generation was quite slow and could lag 10+ minutes.
Since the team liked to expand this component to allow for 30 minute, 1 hour, 2 hour and 6 hour traffic layers, being able to get access to historical positions from the disk efficiently was critical.
Before the upgrade, the system load was very high due to the write-behind from gears (writing to disk) and tile generation (from disk). Even during rush hour and tile regeneration, %iowait stays low and system load stays <1.
Below are the results from sar during a tile regeneration event:
                CPU     %user   %system   %iowait   %idle
20:00:07        all      9.98      9.88     47.08   32.56
# PostgreSQL Aggregations - Disk Heavy --
20:00:22        all     10.22     12.04     41.70   35.22
20:00:37        all     10.46     10.66     61.73   16.95
20:00:52        all     34.89     11.97     34.48   18.56
20:01:07        all      8.00      8.51     55.59   26.97
# Tilegeneration - User Heavy --
20:01:22        all     32.93      8.13     26.42   32.42
20:01:37        all     48.94     10.90     21.29   18.87
# Back to High Idle % --
20:01:47        all      7.19      4.39      5.89   81.24
At the heart of the app was a need to have a database capable of transmitting data with precision and speed. Each Redis component was a vital organ that worked harmoniously with one another to produce a highly-effective real-time tracking-system.
But by merging Redis with Golang, you have the ability to extract data with hyper-efficiency and accuracy. You can see the full app on the Redis Launchpad and be sure to check out the other great apps we have available.
Dustin Wilson
Dustin is a backend engineer who currently works for Numina. To discover more about his work and his activity on GitHub, you can check out his profile here.