


Introducing the Redis Data Source Plug-in for Grafana
Learn more


Earlier this month, Redis released the new Redis Data Source for Grafana plug-in, which connects the widely used open source application monitoring tool to Redis. To give you an idea of how it all works, let’s take a look at a self-referential example: using the plug-in to see how many times it has been downloaded over time. (The Grafana plug-in repository itself does not provide such statistics out of the box.)
Want to learn more? Read Introducing the Redis Data Source Plug-in for Grafana
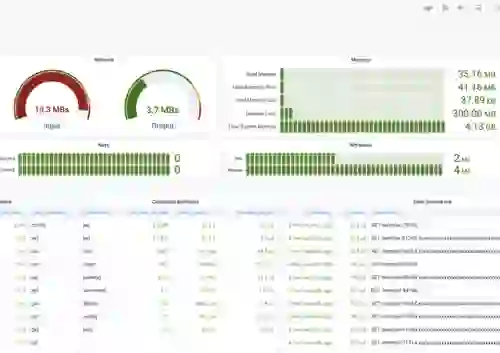
If you’re not familiar with Grafana, it’s a very popular tool used to build dashboards to monitor applications, infrastructures, and software components. The Redis Data Source for Grafana is a plug-in that allows users to connect to the Redis database and build dashboards in Grafana to easily monitor Redis data. It provides an out-of-the-box predefined dashboard, but also lets you build customized dashboards tuned to your specific needs.
The Redis Data Source for Grafana plug-in can be installed using grafana-cli, Docker, or used in the Grafana Cloud. Alternatively the plug-in can be built from scratch following the instructions on GitHub.
grafana-cli plugins install redis-datasource
This demo uses:
Information about any registered plug-in in a Grafana repository can be retrieved using the API in JSON format:
GET https://grafana.com/api/plugins/redis-datasource/versions/latest
{
  "id": 2613,
  "pluginId": 639,
  "pluginSlug": "redis-datasource",
  "version": "1.1.2",
  "url": "https://github.com/RedisTimeSeries/grafana-redis-datasource/",
...
  "downloads": 1153,
  "verified": false,
  "status": "active",
  "packages": {
    "any": {
      "md5": "ea0a2c9cb11c9fad66703ba4291e61cb",
      "packageName": "any",
      "downloadUrl": "/api/plugins/undefined/versions/1.1.2/download"
    }
  },
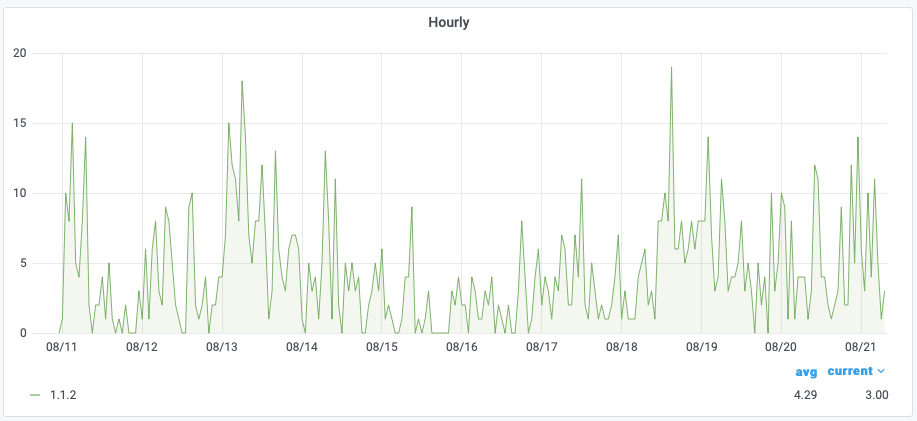
For this example, I wanted to find out how many times Redis Data Source for Grafana plug-in was downloaded per day, and to look for spikes after we tweeted or posted on the Redis blog about it. I decided to use RedisTimeSeries (a Redis module that adds a time-series data structure to Redis) to track the number of downloads every hour.
To populate the data I used the TS.ADD command with an automatic timestamp and labels `plugin` and `version`. X is a number of downloads and the latest version `1.1.2` retrieved from API. Labels will be used later to query the time series.
127.0.0.1:6379> ts.add redis-datasource * X LABELS plugin redis-datasource version 1.1.2
I wrote a simple script using ioredis and Axios libraries to call the API and use plug-in information to add time-series samples:
/**
 * A robust, performance-focused and full-featured Redis client for Node.js.
 *
 * @see https://github.com/luin/ioredis
 */
const Redis = require("ioredis");

/**
 * Promise based HTTP client for the browser and node.js
 *
 * @see https://github.com/axios/axios
 */
const axios = require("axios");

/**
 * You can also specify connection options as a redis:// URL or rediss:// URL when using TLS encryption
 */
const redis = new Redis("redis://localhost:6379");

/**
 * Main
 *
 * @async
 * @param {string} plugin Plugin name
 */
async function main(plugin) {
  /**
   * Get Plugin's data
   *
   * @see https://grafana.com/api/plugins/redis-datasource/versions/latest
   */
  const response = await axios.get(
    `https://grafana.com/api/plugins/${plugin}/versions/latest`
  );

  /**
   * Response
   */
  const data = response.data;
  if (!data) {
    console.log("Where is the data?");
    return;
  }

  /**
   * Add Time-series sample with plugin and version labels
   */
  await redis.send_command(
    "TS.ADD",
    data.pluginSlug,
    "*",
    data.downloads,
    "LABELS",
    "plugin",
    data.pluginSlug,
    "version",
    data.version
  );

  /**
   * Close Redis connection
   */
  await redis.quit();
}

/**
 * Start
 */
main("redis-datasource");
I used a package.json file to install dependencies and ran commands using `npm` as shown here:
{
  "author": "Mikhail Volkov",
  "dependencies": {
    "axios": "^0.19.2",
    "ioredis": "^4.17.3"
  },
  "description": "Get statistics for Grafana Plugin",
  "devDependencies": {
    "@types/node": "^14.0.27"
  },
  "license": "ISC",
  "name": "grafana-plugin-stats",
  "scripts": {
    "redis-cli": "docker exec -it redistimeseries redis-cli",
    "start": "docker-compose up",
    "start:app": "node grafana-plugin-stats.ts"
  },
  "version": "1.0.0"
}
To orchestrate Docker containers, I used docker-compose:
version: "3.4"

services:
  redis:
    container_name: redistimeseries
    image: redis/redistimeseries:latest
    ports:
      - 6379:6379

  grafana:
    container_name: grafana
    image: grafana/grafana:latest
    ports:
      - "3000:3000"
    environment:
      - GF_AUTH_ANONYMOUS_ORG_ROLE=Admin
      - GF_AUTH_ANONYMOUS_ENABLED=true
      - GF_AUTH_BASIC_ENABLED=false
      - GF_ENABLE_GZIP=true
      - GF_INSTALL_PLUGINS=redis-datasource
To run the script every hour and collect the download data, I used crontab on the Linux server in the cloud:
root@grafana:~# crontab -l
5 * * * * node /root/grafana-plugin-stats/stats.ts
To run the script and collect data, you need to install Node.js, Docker, and Docker Compose, following the instructions for your operating system:
> docker-compose up -d

Starting grafana         ... done
Starting redistimeseries ... done
...
redistimeseries | 1:M 08 Aug 2020 21:13:20.405 * <timeseries> Redis version found by RedisTimeSeries : 6.0.1 - oss
...
grafana    | installing redis-datasource @ 1.1.2
grafana    | from: https://grafana.com/api/plugins/redis-datasource/versions/1.1.2/download
...
grafana    | t=2020-08-08T21:13:23+0000 lvl=info msg="Registering plugin" logger=plugins name=Redis
grafana    | t=2020-08-08T21:13:23+0000 lvl=info msg="HTTP Server Listen" logger=http.server address=[::]:3000 protocol=http subUrl= socket=
After running the script, we can check the RedisTimeSeries data using the TS.MRANGE command. You can query a range across multiple time-series by using filters in forward or reverse directions:
127.0.0.1:6379> ts.mrange - + withlabels filter plugin=redis-datasource
1) 1) "diff:redis-datasource"
   2) 1) 1) "value"
         2) "diff"
      2) 1) "type"
         2) "datasource"
      3) 1) "plugin"
         2) "redis-datasource"
      4) 1) "version"
         2) "1.1.2"
   3)   1) 1) (integer) 1597125602559
           2) 0
        2) 1) (integer) 1597129202847
           2) 1
        3) 1) (integer) 1597132802738
           2) 10
The command TS.MRANGE with filter `plugin` retrieves samples only for the `redis-datasource` plug-in. Use the option WITHLABELS to return labels.
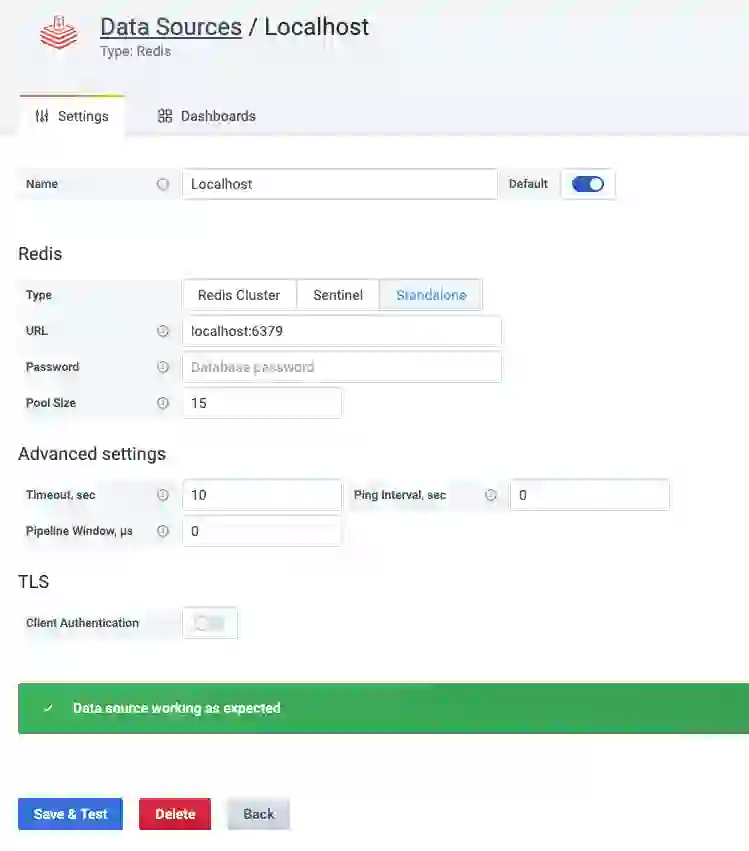
Open Grafana in a web browser using `http://localhost:3000` and create the data source by selecting Configuration -> Data Sources. Redis Data Source for Grafana supports transport layer security (TLS) and can connect to open source Redis OSS, Redis Enterprise, and Redis Enterprise Cloud databases anywhere using a direct connection.
The next step is to create a dashboard with a graph panel to visualize data. Select “Redis Datasource” and “RedisTimeSeries commands” in the query editor. Use the command TS.MRANGE with a plug-in name filter.
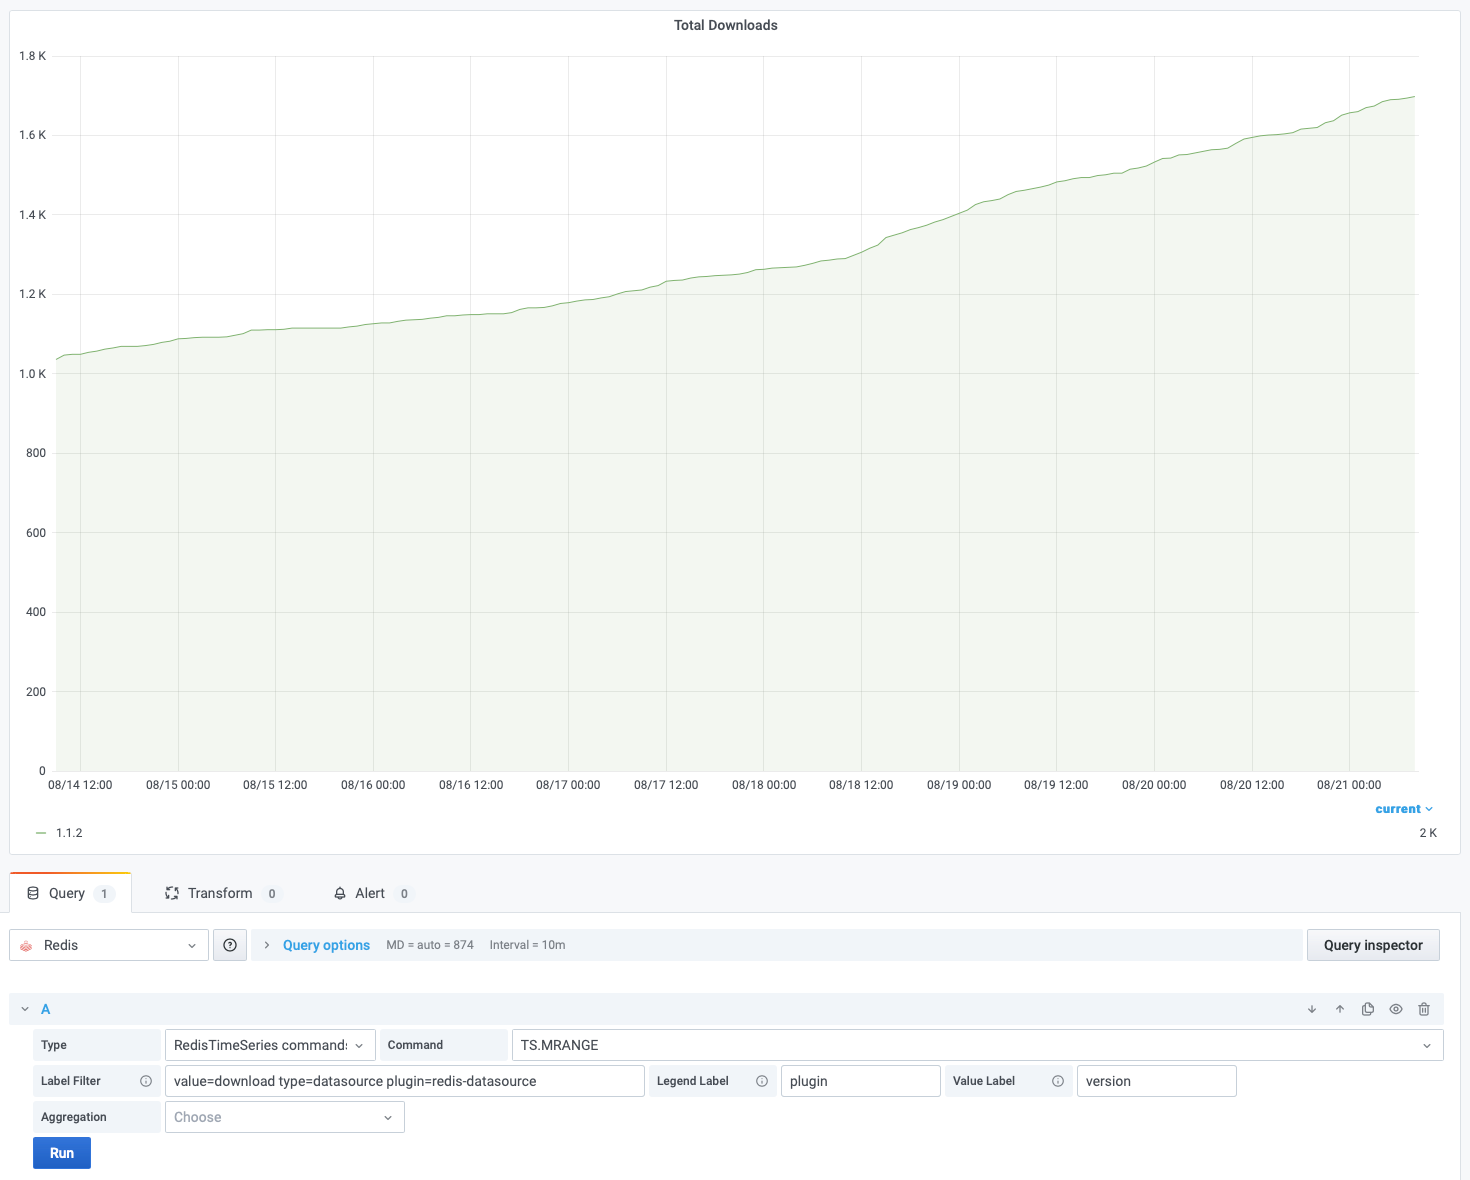
Finally, I named the plug-in Legend Labels and set the version as Value Label, which will make it easier to display the series for later versions of Redis Data Source for Grafana.
Use the command TS.INFO to see the information and statistics for the time series. So far I have collected download data for 250 hours and can see how much memory (in bytes) was allocated to store time-series and other information.
127.0.0.1:6379> ts.info diff:redis-datasource
 1) totalSamples
 2) (integer) 250
 3) memoryUsage
 4) (integer) 4313
 5) firstTimestamp
 6) (integer) 1597125602559
 7) lastTimestamp
 8) (integer) 1598022003033
 9) retentionTime
10) (integer) 0
11) chunkCount
12) (integer) 1
13) maxSamplesPerChunk
14) (integer) 256
15) labels
16) 1) 1) "value"
       2) "diff"
    2) 1) "type"
       2) "datasource"
    3) 1) "plugin"
       2) "redis-datasource"
    4) 1) "version"
       2) "1.1.2"
17) sourceKey
18) (nil)
19) rules
20) (empty list or set)
At the time of publication, Redis Data Source for Grafana plug-in has been downloaded more than 3500 times! We have received valuable feedback from the community and continue developing new features for the data source.
For more information, look at the GitHub repository for the project and let us know if you have any questions in the issues.
I hope this post, and my example using the Redis Data Source for Grafana to track downloads of the plug-in over time, has demonstrated the power and ease of use of this new tool and inspires your to monitor your application data (transactions, streams, queues, etc.) using RedisTimeSeries. Stay tuned for more posts on how and why to use the Redis Data Source for Grafana plug-in.