


Top 9 Takeaways from RedisConf 2021
Learn more


Portfolios form the foundation of the wealth and asset management industry. Ever since Harry Makowitz pioneered modern portfolio theory, asset and wealth management professionals have obsessed over maximizing the returns on their portfolio for a given level of risk. Today, the professionals in the industry are joined by millions of retail investors, whom have forever changed the landscape of investing. These new entrants are creating huge ramifications for the technology underpinning the trading infrastructure of retail brokerages, exchanges, and clearing houses.
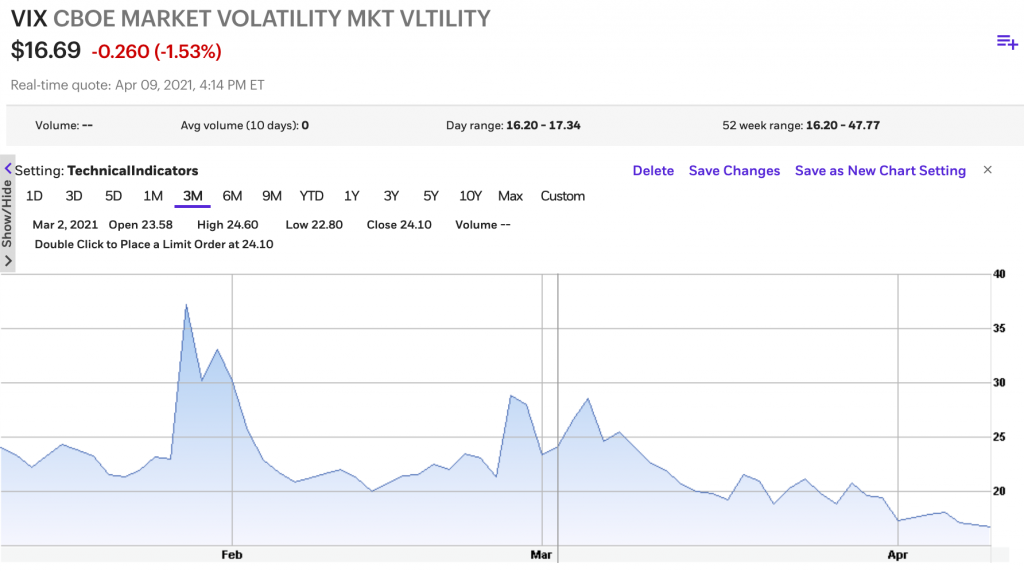
Take, for instance, the GameStop stock mania of January 2021. Retail investors started trading GameStop stock at record levels. These investors also piled into other meme stocks like AMC Entertainment, causing the overall market volatility to rise more than 76% in a matter of a few trading days as measured by the VIX. This volatility led to price pressure on thousands of securities. Millions of investors were frantically trying to access their portfolios at the same time, but were faced with apps that couldn’t keep up with demand. Investors are not kind to companies whose apps do not perform well when they need it the most.
During these frantic times, most investors are looking for two data points about their portfolio that they need access to at all times:
The answers to these questions can lead an investor to buy, sell, or hold specific securities. In today’s fast-moving markets, any delays could mean lost opportunity and profits. You need real-time access to prices to answer these questions—yet there are two big challenges:
The prices of securities can quickly change based on the trading volume, volatility of a specific security, and the volatility in the market. On the other hand, a brokerage could have millions of customers, each of them with a couple dozen securities in their portfolio. As soon as the customer logs in, their portfolio needs to be updated with the latest prices—and keep them updated as the brokerage receives prices from the exchanges.
Essentially, we are creating a real-time stock chart. Many brokerage apps don’t try to do this at scale. Instead, these apps pull the latest prices rather than push the prices to millions of clients. For example, there might be a refresh button on their portfolio page.
These next-generation challenges are not trivial and cannot be easily solved with disk-based databases, which weren’t designed to handle millions of operations per second. The requirements of the financial industry need a database that can scale easily and handle hundreds of millions of operations each second. In comes Redis Enterprise, an in-memory database platform, has the potential to tackle these myriad challenges.

This is the first of a series of blogs covering various real-time use cases in the financial world. We will cover the details and business challenges of each use case and the role Redis Enterprise can play in solving those challenges. As part of the blog, we offer sample designs, data models, and code samples. We will also discuss the pros and cons of each approach.
In this blog post we will cover the following:
Once the client app has retrieved the portfolio and is receiving the latest prices, it can:
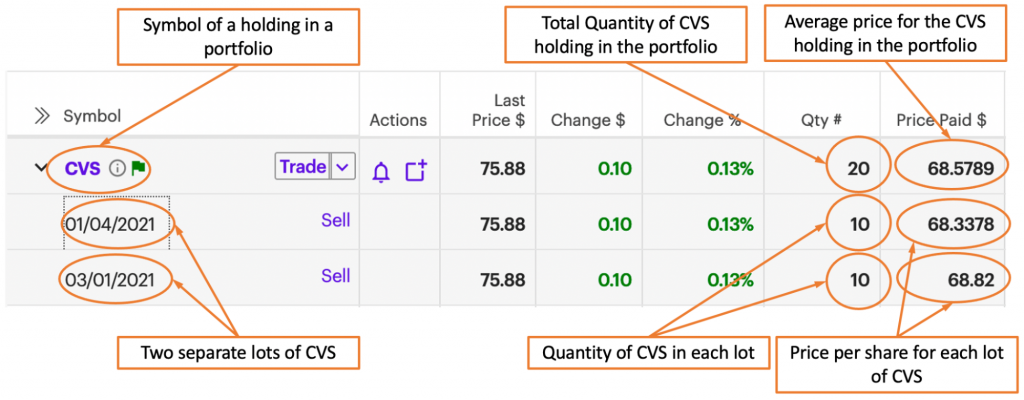
Let’s begin by modeling a holding in a portfolio. In the illustration below, CVS Health Corp. (NYSE: CVS) is one of our example holdings. There were two separate lots of CVS—the first was acquired on January 4, 2021 and the second on March 1, 2021. The same number of shares were purchased during the buy trade for each lot. Both trades were for 10 shares, however at different prices per share—$68.3378 for the first lot and $68.82 for the second. The total quantity of the CVS holding in the portfolio is 20 with an average cost calculated as follows: (($68.3378 * 10) + ($68.82 * 10))/20 = $68.5789 per share.
Redis’ data representation is flat—one cannot embed Sets, for example, within another Set. Therefore the data model as described by an ER diagram cannot necessarily be implemented directly. Implementing the Entity Model directly might not have the desired performance characteristics, so you’ll have to think a little differently as you get down to implementation. In this section we cover some of the basic design principles required when designing a high-performance and scaling implementation using Redis.
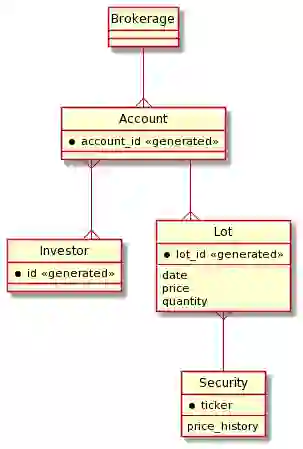
The data model here mentions the following entities:
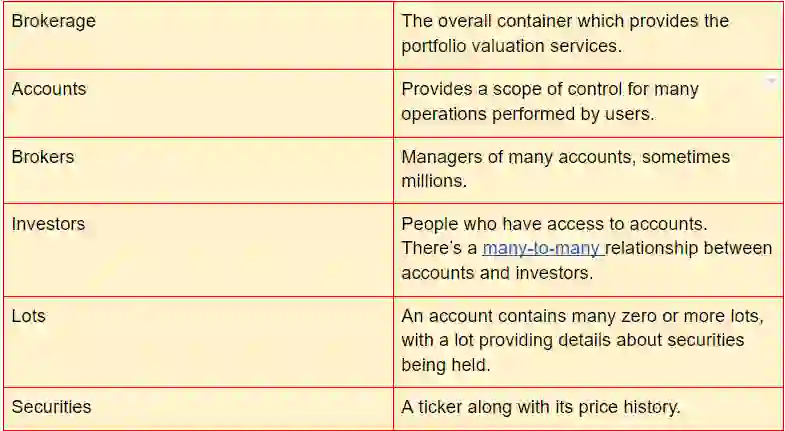
An ER diagram provides a visual representation which can help one see what’s going on.
What’s missing from the diagram above is the set of incoming prices although they are recorded in the security’s price history—and the calculation of the instantaneous value and gains as prices change. So, the ER diagram represents the comparatively static data that is the context in which portfolio valuation is performed.
Key points that need to be considered about this system include:
Given these points, some general approaches are:
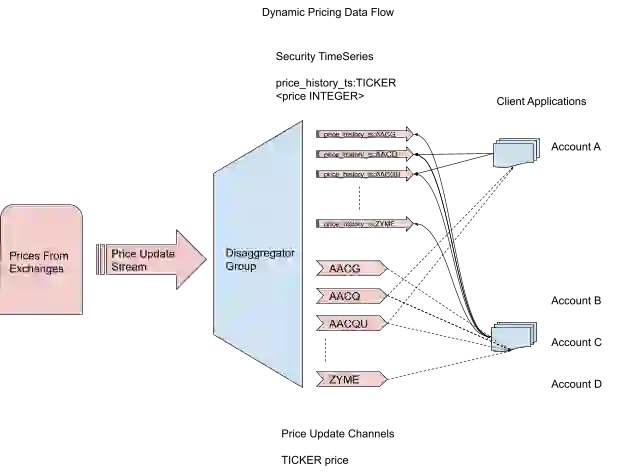
Here are the major computational components and the data flow:

Note that Redis Enterprise consists of one or more nodes across many machines—deployed on-premises, Kubernetes, hybrid cloud deployment, managed service, or native first party cloud service—and there will be hundreds of thousands of investors online with their client(s) of choice.
Security price updates will be absorbed by Redis Streams. Updates for securities will be mixed together in this stream and will need to be disaggregated to make the data useful. A consumer group will be used to perform that disaggregation, and to process data into two structures, per security:
The following diagram details this part of the architecture:
The most important factor in our model is the account-specific data representing lots and the related security. We’ll compare two implementations as an example of how to think about modeling data in Redis, with a focus on performance. Other implementations are possible—our goal here is to introduce the overall design principles and thought processes when implementing data in Redis.
We’ll use the following information as a concrete example:
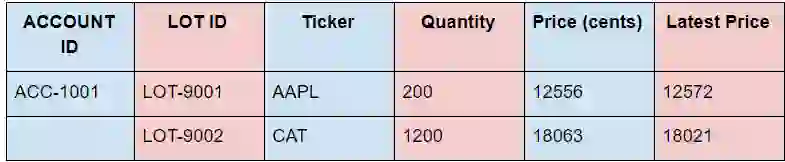
We are pricing in the lowest possible currency denomination to avoid floats and keep everything in integers. We can allow the client to handle transformation to dollars and cents. In this example, we are using the prices with precision of two decimal places.
Our first implementation records the id’s of all the lots in the account using a SET, identified by account id, and then uses one Redis HASH per LOT, identified by LOT ID, with the ticker, quantity, and purchase price as the fields. In other words, we’re using the HASH to model the LOT entity structure, with each attribute of the LOT entity being a field in the Redis HASH.
With this data model we have a key for each account and a value containing all the LOT IDs for that account stored as a Redis SET:
lotids:<ACCOUNT_ID> SET <LOTID>
In addition, for each lotid, we’d have a HASH whose fields are the ticker, quantity, and purchase price:
lot:<LOTID> HASH <ticker TICKER> <quantity INTEGER> <price INTEGER>
Concretely, we’d create the keys like this:
127.0.0.1:6379> SADD lotids:ACC-1001 LOT-9001 LOT-9002
(integer) 2
127.0.0.1:6379> HMSET lot:LOT-9001 ticker AAPL quantity 200 price 12556
OK
127.0.0.1:6379> HMSET lot:LOT-9002 ticker CAT quantity 1200 price 18063
OK
The RedisTimeSeries module allows the storage and retrieval of related pairs of times and values, along with high-volume inserts and low-latency reads. We are going to get the latest price for the tickers of interest the client would access when using the corresponding time series keys:
price_history:<TICKER> TIMESERIES <price INTEGER>
127.0.0.1:6379> TS.GET price_history:APPL
1) (integer) 1619456853061
2) 12572
127.0.0.1:6379> TS.GET price_history:CAT
1) (integer) 1619456854120
2) 18021
and subscribe to the pricing channel for updates:
<TICKER> SUBSCRIPTION_CHANNEL
To get all the data, the client would perform the following operations:
The overall time complexity is O(N +T).
Concretely, operations one and two would be:
127.0.0.1:6379> SMEMBERS lotids:ACC1001
1) "LOT-9001"
2) "LOT-9002"
127.0.0.1:6379> HGETALL lot:LOT-9001
1) "ticker"
2) "AAPL"
3) "quantity"
4) "200"
5) "price"
6) "12556"
127.0.0.1:6379> HGETALL lot:LOT-9002
1) "ticker"
2) "CAT"
3) "quantity"
4) "1200"
5) "price"
6) "18063"
We can minimize network latency by using pipelining (a form of batching on the client side) and/or repeated use of LUA scripts (using SCRIPT LOAD & EVALSHA). Side note: Transactions can be implemented using pipelines and can provide reduced network latency, but this is client specific and their goal is atomicity on the server, so they don’t really solve the network latency problem. Pipelines comprise commands whose inputs and outputs must be independent of one another. LUA scripts require all keys to be provided in advance and that all of the keys are hashed to the same slot (see the Redis Enterprise docs on this topic for more details).
Given these constraints we can see that the assignment of operations to pipelines is:
and that using LUA scripts isn’t possible because each operation uses different keys and those keys have no common part that can be hashed to the same slot.
In utilizing this model we have a time complexity of O(N+T) and three network hops.
An alternative model is to flatten the LOT entity structure and to represent each entity attribute using a key identified by account id—one such key for each attribute (quantity, ticker, price) of a lot. The fields in each HASH will be the LOT ID and a corresponding value to either quantity, ticker, or price. Thus we’d have keys:
tickers_by_lot: <ACCOUNT_ID> HASH <LOTID TICKER>
quantities_by_lot:<ACCOUNT_ID> HASH <LOTID INTEGER>
prices_by_lot:<ACCOUNT_ID> HASH <LOTID INTEGER>
These hashes would replace the LOTID and LOT keys from Data Model A, while the price_history and <TICKER> keys would remain the same.
Creating the keys:
HSET tickers_by_lot:ACC-1001 LOT-9001 AAPL LOT-9002 CAT
HSET quantities_by_lot:ACC-1001 LOT-9001 200 LOT-9002 1200
HSET prices_by_lot:ACC-1001 LOT-9001 125.56 LOT-9002 180.63
Retrieving the values:
127.0.0.1:6379> HGETALL tickers_by_lot:ACC-1001
1) "LOT-9001"
2) "AAPL"
3) "LOT-9002"
4) "CAT"
127.0.0.1:6379> HGETALL quantities_by_lot:ACC-1001
1) "LOT-9001"
2) "200"
3) "LOT-9002"
4) "1200"
127.0.0.1:6379> HGETALL prices_by_lot:ACC-1001
1) "LOT-9001"
2) "12556"
3) "LOT-9002"
4) "18063"
The operations required by the client would now be:
This has an overall time complexity of O(N+T)—same as before.
From a pipeline perspective this becomes:
So we’ve reduced the number of network hops by one—not a lot in absolute terms, but 33% in relative terms.
In addition, we can easily use LUA since we know the keys, and we can map all the keys for any specific account to the same slot. Given the simplicity of operations we’ll not dig into LUA further, but note that this design makes it at least possible!
In a simple benchmark, Data Model B ran 4.13 ms faster (benchmarked over thousands of runs). Given that this is only run once each time a client is initialized for an account, this likely has no impact on overall performance.
In this blog, we’ve shown two possible implementations of the Entity model using Redis data types. We’ve also introduced the time complexity analysis that should be performed whenever choosing a Redis data type, along with a consideration of network performance improvements—a critical step when large scale and high performance are required. In subsequent blogs, we’ll expand further on these ideas as the data model is expanded.
We have introduced some of the business challenges in managing securities portfolios at scale and have shown the following:
With these two critical features in place, a brokerage app client can provide real-time portfolio updates that perform and scale to handle millions of accounts. This design can present the total value of the portfolio and the gain or loss across each holding in real-time. This data model and architecture can also be applied to use cases beyond securities to cover crypto, ad exchanges, etc.