

Redis Clustering Best Practices With Multiple Keys
Learn More


When running in production, a system logs many events and alerts, helping administrators monitor what is happening in a system and be notified automatically when they need to respond to an issue. For example:
This post will cover how Redis Enterprise uses the syslog service to log events and alerts, and will explain how to:
To put this in context, Redis Enterprise manages many logs, held by default in the /var/opt/redis/log directory, but we’re going to focus on the use of syslog as laid out in the Redis documentation. Hopefully, by the time you finish reading, you will know how to:
Before we start, you’ll need to have a Redis Enterprise Software cluster up and running as well as a Linux instance to run syslog server. (Note that for this post, I used a 3-node cluster of Redis Enterprise 5.4.14-28, running on CentOS 7.x., and another Linux instance to run syslog server.)
On all nodes, you will see a /var/opt/redis/log directory in which Redis Enterprise writes all the logs. Let’s focus on the event_log. This file is managed by the Redis Enterprise alert manager service, which generates entries based on the configuration of the cluster and database alerts, and logs various administrative actions, such as database creation, configuration, and deletion.
If you open `/var/opt/redis/log/event_log.log` file, you will see entries that look like this:
2020-04-06 15:30:46,425 INFO event_log EventLog: {"originator_username":"Administrator","object":"bdb:7","extra":{"bdb_uid":"7","bdb_name":"db-002"},"object_type":"bdb","originator_email":"admin@demo.com","originator_uid":1,"time":1586187046,"throttled_event_count":1,"obj_uid":"7","type":"creation_request"}
2020-04-06 15:30:47,896 INFO event_log EventLog: {"originator_username":"system","object":"cluster","extra":{"bdb_uid":"7","bdb_name":"db-002"},"object_type":"cluster","originator_uid":0,"time":1586187047,"throttled_event_count":1,"obj_uid":null,"type":"bdb_created"}
…
2020-04-06 15:32:20,073 CRITICAL event_log EventLog: {"originator_username":"system","object":"node:2","object_type":"node","state":true,"originator_uid":0,"time":1586187140,"throttled_event_count":1,"obj_uid":"2","type":"failed"}
The log entries have the following basic structure:
timestamp severity event_log EventLog:{<list of key value pairs in any order>}
These events are managed at the cluster level, so only the master node of the cluster is writing in events in the event_log file at a specific moment in time. Let’s run the `rladmin` command on the cluster:
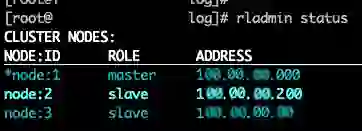
As you can see, the node:1 is the master of the cluster. This means that the event_log will be populated there. If the master moves to another node, the events will be saved on the new master.
These logs are managed by Redis cluster logging infrastructure. However, Redis Enterprise also uses syslog. You will find the same log entries in the /var/log/messages file:
Apr 8 05:32:20 ip-100-00-00-000 event_log[2015]: {"originator_username":"system","object":"node:2","object_type":"node","state":true,"originator_uid":0,"time":1586187140,"throttled_event_count":1,"obj_uid":"2","type":"failed"}
Note that the same entry is present with the name of the host and process as a prefix:
(ip-100-00-00-000 event_log[2015])
Let’s now look at the configuration of Redis Enterprise to see how and why the logs are used by rsyslog. Redis Enterprise logging is configured in the /opt/redis/config/logging.conf file:
{
    "version": 1,
    "disable_existing_loggers": false,
    "formatters": {
        "standard": {
            "format": "%(asctime)s %(levelname)s %(name)s %(threadName)s: %(message)s"
        },
        "syslog": {
            "format": "%(name)s[%(process)d]: %(message)s"
        }
    },

    "handlers": {
        "console": {
            "class": "logging.StreamHandler",
            "formatter": "standard",
            "stream": "ext://sys.stdout"
        },
        "syslog": {
            "class": "logging.handlers.SysLogHandler",
            "formatter": "syslog",
            "facility": "daemon",
            "address": "/dev/log"
        }
    },

    "loggers": {
        "": {
            "level": "INFO"
        },
        "event_log": {
            "level": "INFO",
            "handlers": ["syslog"],
            "propagate": false
        }
    }
}
This file contains two interesting sections for this post:
loggers.event_log defines which handler(s) are used to log events
handlers.syslog defines the handler. The default configuration uses the “daemon” “facility”.
Keep in mind that if you change the /opt/redis/config/logging.conf it will be overridden when you update Redis Enterprise. In the following sections, I will explain how to control logging using syslog without touching any Redis Enterprise configurations. If you do change the logging configuration, you must run the following command to make it active:
$ supervisorctl restart alert_mgr
What is a syslog facility?
Syslog facility is a configuration entry located in /etc/rsyslog.conf that defines where a syslog message will be written, based on the origin of the message. You can find more information about facilities in the syslog Wikipedia page, including the list of available facilities.
As noted above, by default Redis Enterprise uses the daemon facility that is used to log system daemons. Syslog also defines the facilities local0 to local7 to let administrators configure a custom logging strategy.
We’re now ready to configure syslog. Let’s start by creating a new configuration file to contain all the specific information for Redis event logging.
Create the file as shown here:
/etc/rsyslog.d/redis.conf
And add the following configuration:
template(name="RedisEventTemplate" type="string" string="%syslogseverity-text%:%pri-text%:%timegenerated%:%HOSTNAME%:%syslogtag%:%msg:::drop-last-lf% -- %syslogtag%  -- %programname% \n")

if $programname startswith 'event_log' then {
  action(type="omfile" file="/var/log/redis.log" template="RedisEventTemplate" )
}
With this configuration, the syslog service will:
You can learn more about the template syntax in the syslog documentation.
Finally, restart syslog:
systemctl restart rsyslog
Testing the new configuration
Go to the Redis Enterprise web console and create a new database (or edit an existing database). You should see a new /var/log/redis.log file and the event you generated. Here’s an example of what a log entry might look like:
info:local5.info 17:48:47:ip-00-00-00-00:event_log[14176] ::{"originator_username":"Administrator","object":"bdb:18","extra":{"old_val":"dd2","new_val":"db01","attr":"name"},"object_type":"bdb","originator_email":"admin@demo.com","originator_uid":1,"time":1586281727,"throttled_event_count":1,"obj_uid":"18","type":"updated"}
In this example, the first part of the log entry (info) is the severity, that you can use later to capture specific events.
Configuring the full cluster
As mentioned earlier, you are configuring Redis Enterprise and syslog on only one node (the master node), so you have to repeat these steps on each node in the cluster.
Redis Enterprise cluster is now configured to use a custom syslog configuration to capture events and alerts; it is possible now to use the syslog capabilities.
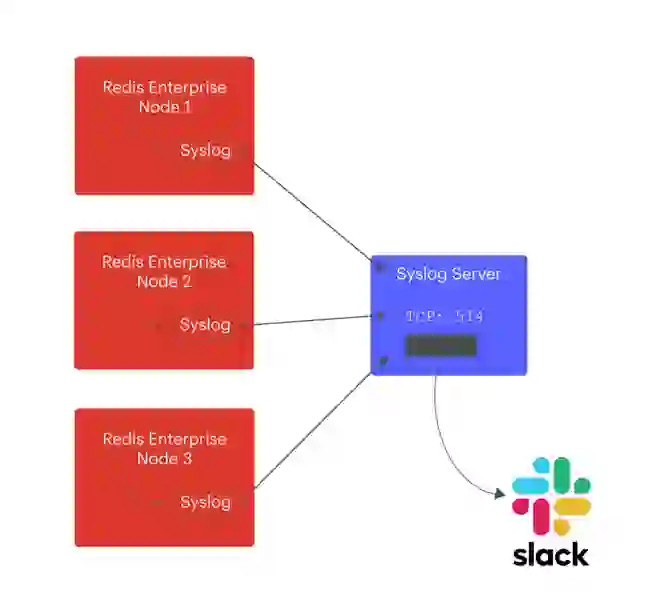
A common syslog use case is to aggregate all your logs into a single location for processing. Syslog provides a server capability to do this, you just need to add a new action in the syslog configuration to send the messages on the network.
To send all messages to a centralized logging server, let’s add a new action in the /etc/rsyslog.d/redis.conf file:
template(name="RedisEventTemplate" type="string" string="%syslogseverity-text%:%pri-text%:%programname%:%timegenerated%:%HOSTNAME%:%syslogtag%:%msg:::drop-last-lf% \n")

if $programname startswith 'event_log' then {
  action(type="omfile" file="/var/log/redis.log" template="RedisEventTemplate" )
  action(type="omfwd" protocol="tcp" target="10.0.0.12" port="514" template="RedisEventTemplate" )
}
Restart the syslog service:
$ systemctl restart rsyslog
If you generate an event from Redis Enterprise, for example by editing a database, you should see a new event in the /var/log/messages file in the syslog server you are pointing to.
All Redis cluster events are sent to a centralized syslog server, writing these events in the /var/log/messages file.
You can now use this server to parse and integrate these messages with any other tool such as Splunk, Syslog Watcher, or Datadog. For example, a nice and easy flow would be to parse the messages from the log file and send a message to Slack when a specific pattern is met. Here’s how to do that:
Creating incoming Slack webhooks
The Slack incoming webhook is a simple REST endpoint that you can use to post messages to Slack.
Writing the Python message parser
Now that the Slack webhook is in place, let’s use a simple Python script to tail this file, and check if the new line comes from Redis event_log and contains the string failed. When it does, the script will push the message to Slack using a simple webhook.
The redis-alert.py script looks like this:
import time
import json
import requests
import re
import sys

# Read log
def tail(f):
    f.seek(0, 2)
    while True:
        line = f.readline()
        if not line:
            time.sleep(0.1)
            continue
        yield line

# Parse line and send message if match
def analyze_message(line, text):
    if re.search(r"\bevent_log\b", line) and  re.search(r"\b"+ text + r"\b", line):
        webhook_url = 'https://hooks.slack.com/services/YOUR_HOOK/URL/SLACK'
        slack_data = {'text': '"' + line + '"'}
        response = requests.post(
            webhook_url, data=json.dumps(slack_data),
            headers={'Content-Type': 'application/json'})

# Run the application
while True:
    print(sys.argv[1])
    auditlog = tail( open (sys.argv[1]) )
    for line in auditlog:
        analyze_message(line, sys.argv[2])
Here is the script on the syslog server that aggregates all Redis events:
$ python redis-alert.py /var/log/messages failed
To see how it works, generate a node failure, for example by forcing a reboot one of the nodes. You should see a notification in your Slack channel:

This Python script is very simple, it sends the message exactly as it is received.
Syslog is a powerful tool to capture, organize, filter, and move log entries in various places. In this post we configured Redis Enterprise and syslog to capture cluster events and alerts in a custom format and sent these entries to a central syslog server. If you want to learn more about using syslog, go to the official RSylog documentation.