
Let’s start with data science fundamentals, and consider the concept of data, its typology of data, its main characteristics, and its impact on our way of life.
Data is any organization’s most valuable asset. Beyond the obvious reasons to collect data – customer records, accounting information, project information, and the other elements by which a knowledge-based organization makes money – the data also provides insights into customer behavior, market trends, and product performance that help inform decisions about allocating resources. As a result, companies often invest in collecting or purchasing data from third-party sources to gain a competitive advantage over their competitors.
Data is any information you collect that is organized and structured to make it worthwhile for analysis. Data is collected every time you make a purchase, navigate a website, travel, make a phone call, or post on a social media site. Data can come from many sources, including sensors, surveys, experiments, observations, or existing records (historical data) such as financial transactions. Never before has so much data about many different things been collected and stored every second of every day.

The theory of information pushed the concept of data way further. The Theory of Information is a field of study that seeks to understand the nature and origin of information. According to this study, everything can be considered data. This includes physical objects as well as abstract concepts such as ideas or emotions. Furthermore, data is defined as any set of symbols that conveys meaning when interpreted by a receiver. Therefore anything that has some form of symbolic representation (such as DNA sequences, words, or numbers) could be classified as data in this context.
Data is classified depending on a given perspective, such as by value, velocity, structure, sensitivity, or any number of other characteristics.
From a purely statistical point of view, data can be part of two major categories according to their value.
Quantitative (numerical) data is any information that can be expressed, measured, and compared using numerical values, such as integers or real numbers.
Examples of quantitative data include height, weight, length, temperature readings, population size, or countable items such as the number of students in a classroom. This type of data can be further divided into discrete values (whole numbers) or continuous values (decimals).
Qualitative (categorical) data is non-numerical information such as opinions, feelings, perceptions, and attitudes. This data can answer questions such as, “How did it occur?” or “Why did this occur?” Examples of qualitative data include gender, rankings, and enumerations.
This kind of data can be divided into nominal or ordinal.
Statistically, qualitative variables must be transformed into dummy variables before any analysis. For example, we can artificially assign numbers to categories. For instance, if your categories are colors, we could assign the number 1 to red and 2 to blue, but these do not have meaning in any mathematical sense. We would not conclude that blue is twice as much as red is!

Data… information… knowledge. What is the difference? The DIKW model, which describes the relationship between data, information, knowledge, and wisdom, answers this question and the underlying one: What is the finality of data?
In the DIKW model, data is considered raw material for wise decision-making because it provides an objective basis for drawing conclusions. By analyzing large amounts of data in various ways, such as through statistical analysis or machine learning algorithms, we can uncover patterns within the data that may not previously have been obvious. This information is then processed into meaningful insights, forming the basis of decision-making processes. Finally, wisdom comes in when these insights are applied with experience and judgment so that someone can make an informed choice about what action should occur next, influencing future strategies.

Thus, data adds value by providing insights and information that can be used to make informed decisions. Data helps organizations identify trends, measure performance, optimize processes, improve customer experience, and drive innovation. It also enables businesses to gain a competitive edge in the market through better decision-making capabilities based on data analysis.
I deeply appreciate the power and the impact that the data has. Coming to the table with concrete evidence in data, in comparable titles, really allows any team to feel holistically comfortable with how we forecast the business, based on signals, measures, and facts.
In the early years of this century, data was only studied in terms of three characteristics, known as the three V’s of Data: Volume, Velocity, and Variety. Over time, two more V’s – value and veracity – were added to help data scientists and managers more effectively articulate and communicate the essential characteristics of the data they work with.
The five main and innate characteristics of data are:
Marketing organizations added two additional data characteristics that can significantly affect the insights it generates. These two characteristics are:
In an organization, the meaning can constantly change, significantly impacting data homogenization. This concept differs from variety. A coffee shop can offer six different blends of coffee – representing Variety – but you get the same blend every day. But Variability captures the variations of taste that can occur even within a single coffee blend and the factors that cause them, such as supply chain conditions, store temperature, water quality, and the brewing equipment.
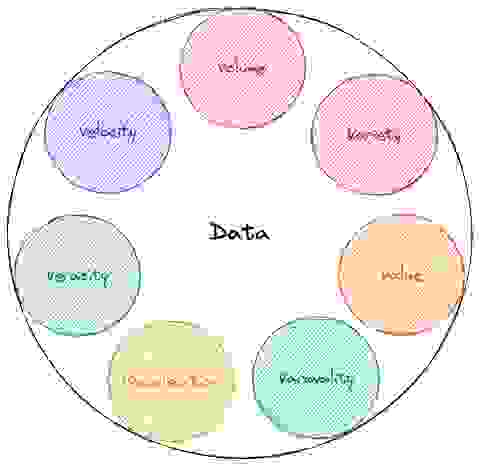
Ultimately, data scientists today pay attention to 7 Vs of data – and as I continue in this series, you will too.
Want to apply data modeling concepts to your current projects? We wrote a comprehensive e-book, Data Modeling Patterns in Redis, that goes through eight scenarios and shows how to model them in Redis, accompanied bycode snippets.