Citi Bike remains the nation’s favorite bike share program. With over 20,000 bikes scattered across Manhattan, Brooklyn, Queens, and the Bronx, getting from A to B has never been easier. It’s cheap, it’s convenient and it’s green.
And most notably, it’s popular. Thanks to this Launchpad App, you’re now able to discover how many bikes are used at different times, throughout each day, in different neighborhoods across the city.
Despite New York offering other modes of transport, those who are committed to a healthier and greener way of living can plan their trips in advance by knowing what times they’re most likely to have access to one of these bikes through the NYC Bike application.
Once again, RedisGraph was the crux of this app by executing lightning-fast queries that enable the user to visualize the traffic patterns that occur around the network. Let’s explore how this was achieved.
But before we dive into the nuts and bolts of this application, we’d like to point out that we have a diverse range of applications on the Launchpad for you to check out.
So make sure to have a browse after this article.
You’ll build an application that can provide users with a clear and detailed visualization of the different traffic patterns that exist in each area of New York. Using RedisGraph, users will be able to drag a geospatial index across different locations to uncover precise figures on the number of Citi Bike users across a period of time.
Below we’ll walk you through each stage in methodical order, uncovering how each component should be deployed along with its functionality.
In its purest sense, Citi Bike is New York’s most popular bike rental program. Users have access to over 20,000 bikes and 1,300 stations as a cheap and convenient way to get around the city. Getting from A to B on one of these bikes is simple.
Using a ride code or a member’s key, you’ll be able to unlock a nearby bike and take as many short rides as you want while your membership is active. Spanning the Bronx, Brooklyn, Manhattan, and Queens, Citi Bike covers most of the densely populated areas in the city’s centre.

Install the software below:
Clone the repository.
https://github.com/redis-developer/nycbike
Create a new account by clicking https://www.mapbox.com/

Access MapBox Access token by clicking https://account.mapbox.com/access-tokens/

Run the command below to copy the access token to frontend/.env:
echo "REACT_APP_MAPBOX_ACCESS_TOKEN=<your-token>" > frontend/.env
Build the visual UI components, and run them using Docker Compose:
$ docker build -t nycbike backend
$ cd frontend; npm install; npm run-script build; cd ..
$ docker-compose up
redismod_1 | 1:C 13 May 2021 03:12:18.017 # oO0OoO0OoO0Oo Redis is starting oO0OoO0OoO0Oo
[...]
backend_1 | 2021/05/13 03:09:35 Connected to Redis!
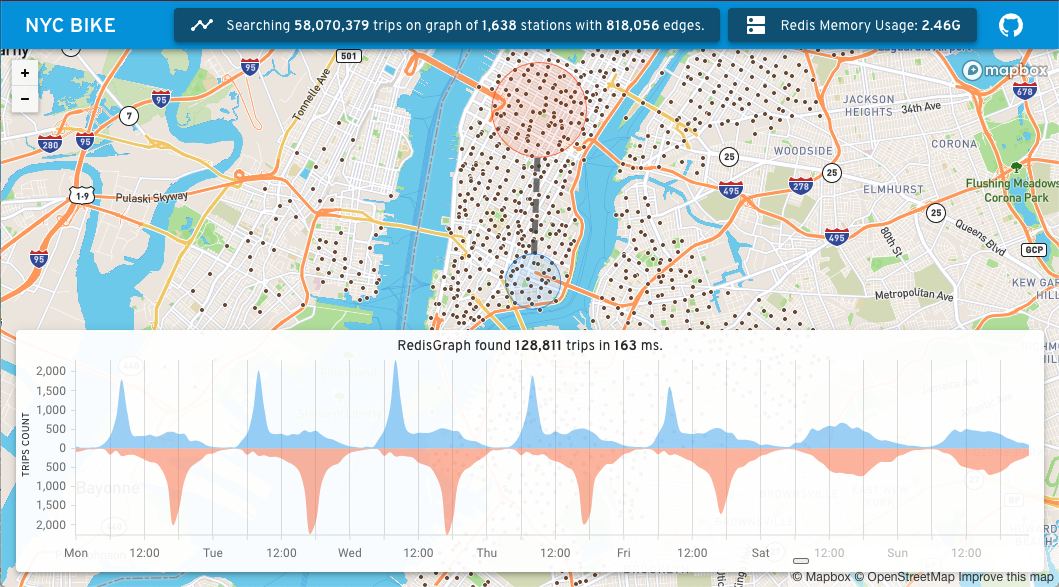
backend_1 | 2021/05/13 03:09:55 Found 58070379 trips, 1638 stations, 818056 edges. Memory usage: 2.46G
backend_1 | 2021/05/13 03:09:55 Running app on port 3000...
[...]
nginx_1 | 172.18.0.1 - - [13/May/2021:03:13:02 +0000] "GET /api/journey_query?src_lat=40.715653603071786&src_long=-73.98651260399838&src_radius=0.7&dst_lat=40.75472153232781&dst_long=-73.98468539999953&dst_radius=1.2 HTTP/1.1" 200 1328 "http://localhost/" "Mozilla/5.0"
[...]
The frontend should now be accessible at http://localhost:80/, but the map will be blank as Redis is empty.

$ docker-compose up
Results:
redismod_1  | 1:C 13 May 2021 03:12:18.017 # oO0OoO0OoO0Oo Redis is starting oO0OoO0OoO0Oo
 [...]
backend_1   | 2021/05/13 03:09:35 Connected to Redis!
backend_1   | 2021/05/13 03:09:55 Found 58070379 trips, 1638 stations, 818056 edges. Memory usage: 2.46G
backend_1   | 2021/05/13 03:09:55 Running app on port 3000...
 [...]
nginx_1     | 172.18.0.1 - - [13/May/2021:03:13:02 +0000] "GET /api/journey_query?src_lat=40.715653603071786&src_long=-73.98651260399838&src_radius=0.7&dst_lat=40.75472153232781&dst_long=-73.98468539999953&dst_radius=1.2 HTTP/1.1" 200 1328 "http://localhost/" "Mozilla/5.0"
 [...]
Each reload of the UI at http://localhost:80/ should show these trips accumulating. On the live demo, there is a pre-built dump.rdb which is 674MB on disk.

Drag the orange circle to some other location and you might notice that RedisGraph displays trips in ms.


Citi Bike publishes all of their trip data online, providing users with answers to some of the most commonly asked questions about this public bike system. These include:
The graph has a source and a destination for each trip. This is highlighted by the two circles on the map, with the blue circle representing the area from where bikes depart and the red circle representing where the journey ends. The flow of traffic within each circle is depicted in the graph below.

An amazing feature of this application is flexibility on the user interface. You can drag and drop both circles to any desired location on the map to discover that area’s flow of traffic. Equally, you can zoom in and out of each circle and decide on the size of its circumference based on your preference.
As you drag each circle, RedisGraph processes the data at lightning speed, providing you with a detailed overview of each region’s flow of traffic within milliseconds. This is really handy if you want to make plans in advance and avoid the hassle of waiting around for a Citi Bike.
The Go backend uses the redisgraph-go library to proxy graph queries from the front end. It’s important to highlight that the Go library doesn’t support the new point() type and so you can add the PR redisgraph-go#45 feature instead.
To mark every station on the map (/stations API call), you can use a simple Cypher query to fetch all of the locations:
ATCH (s:Station) RETURN s.loc
To count all the edges in the graph (part of /vitals API call), you can use a different Cypher query:
MATCH (:Station)-[t:Trip]->(:Station) RETURN count(t)
And finally, the main Cypher query to retrieve journeys (/journey_query API call) is of the form:
MATCH (src:Station)<-[t:Trip]->(dst:Station)
WHERE distance(src.loc, point($src)) < $src_radius
  AND distance(dst.loc, point($dst)) < $dst_radius
RETURN
  (startNode(t) = src) as egress,
  sum(t.counts[0]) as h0_trip_count,
  ...
This matches all of the:Stations within the $src and $dst circles, and all of the trip edges between these stations (in both directions). This is a fast query due to the geospatial index on the following:
:Station.loc
The returned egress that you’ll see is true if the trip started at $src, and it’ll be false if it started at $dst. And regarding the trip graph that’s presented on the UI, it’s built by aggregating properties on these :Trip edges, for both egress and ingress traffic.
The frontend is built in React and around react-mapbox-gl and the custom drawing modes that have been implemented. And the aggregated trip graph is built using devexpress/dx-react-chart.
Offline_importer
The offline importer downloads the public Citi Bike trip data, unzips each archive, and indexes all of the trips into the journeys graph. The graph contains every :Station as a node, an index on the station ID, and a geospatial index of the station’s locations:
This Cypher query will either create a new hedge with one trip or will increment the appropriate counter on the edge to index the trip. The most efficient way for you to write all of the 56 million trips is to use pipelining and turn CLIENT REPLY OFF for each batch. The bulk import will take a couple of hours.
2021/05/12 22:58:56 [dww.0]: Flushing 10000 commands, 10000 trips
2021/05/12 22:59:01 [dww.0]: Flushing 10000 commands, 10000 trips
2021/05/12 22:59:05 [dww.0]: Flushing 10000 commands, 10000 trips
Each reload of the UI at http://localhost:80/ will show how these trips accumulate. In the live demo, a prebuilt dump.rdb was used, which is 674MB on disk.
Processing speed often determines the quality of an application. Anything that’s slow and jarring will hamper the user’s experience and even frustrate plans for a creative app to come to fruition.
Redis’ ability to process queries at a phenomenal rate allowed the app to function to its full potential by displaying the different traffic patterns of each designated area. As a result you can toggle freely between different neighborhoods to discover the traffic flow and work out your optimal route.
You can discover more about the ins and outs of this innovative application by visiting the Redis Launchpad. While you’re there, you might also want to browse around our exciting range of applications that we have available.


Mitch Ward
Mitch is currently a staff engineer at Datadog.
Make sure to visit his GitHub page to see all of the latest projects he’s been involved in.