

Go-Redis Is Now an Official Redis Client
Learn more


Everyone needs a way to monitor server behavior, if only to confirm that the system is running to spec. Several Application Performance Monitoring (APM) tools work with Redis, but perhaps you haven’t heard of Uptrace. Let me tell you about it.
Uptrace is an OpenTelemetry-based observability platform that helps developers and Ops users monitor and optimize complex distributed systems. It’s an open-source APM tool that supports distributed tracing, metrics, and logs. Automatic alerts for critical infrastructure can be sent via email, Slack, Telegram, and other notification channels.
Uptrace is a great platform for monitoring Redis that you should know about. Let’s dive in.
Uptrace is an open source APM available both as an open-source version and an enterprise cloud version; the latter has more features and support options. The open-source version is quite robust as it has Prometheus remote write, AWS CloudWatch, vector logs, percentiles, and alerting, to name just a few examples. To evaluate its use with Redis, we set up open-source deployments of Uptrace and also tested the enterprise edition, called Uptrace Cloud.
Its UI looks amazing, and it genuinely is easy to navigate.
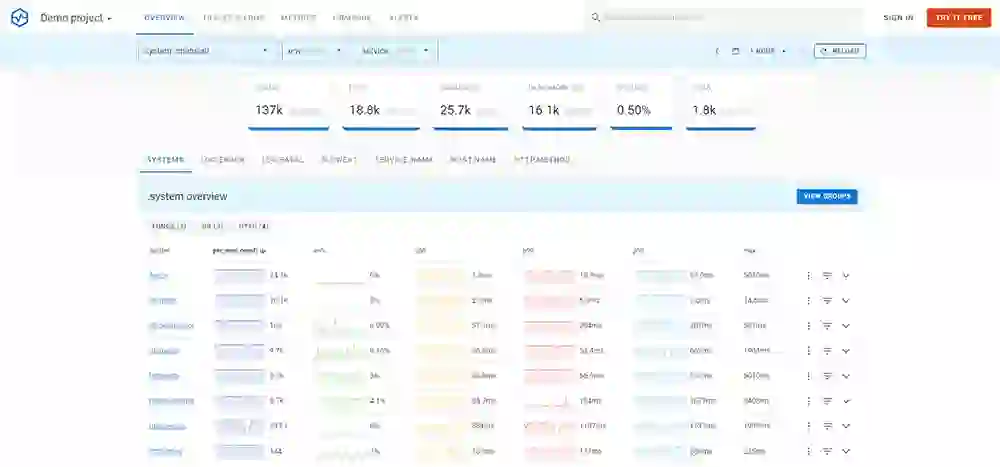
You can connect to multiple databases but, for our purposes, we drill down to just see the Redis database. It presents us with traces of how our GET, SET, and DEL commands are doing. That provides a quick health check on our cache performance.
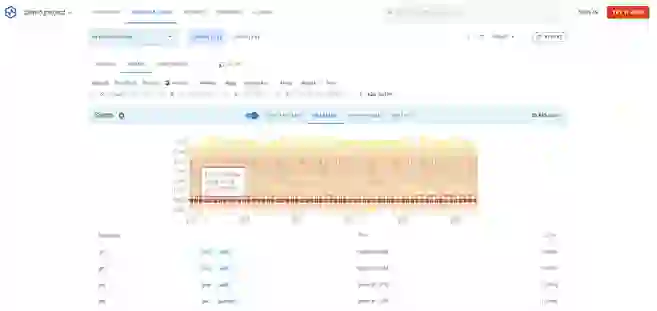
The Uptrace spans tab helps us visualize command responsiveness down to the millisecond using a heatmap. This gives a quick, easy look at whether a Redis database is performing to expectations. If the heat moves a bit higher (longer millisecond response time), then a bottleneck is starting or inefficiencies are developing.
In the image below, this Redis database is completing the majority of GET, SET, and DELETE commands at around 1 millisecond, which is a good target for our cache performance.
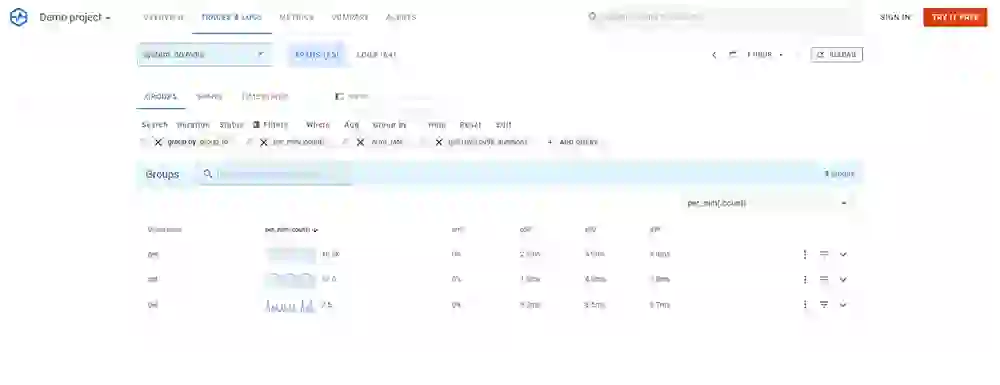
You can build your own custom metrics that appear on the Uptrace dashboard. For example, memory usage is an important metric for Redis. This screen capture shows how to accomplish that.
Uptrace has plenty of other appealing features. One that we found super useful is its optimized storage, which includes performance optimization for common queries, efficient sharding for databases, and improved support for cold storage like S3. Specifically for Redis, Uptrace also supports improved storage policies that give more flexibility to move data between SSD and cold storage; doing so reduces costs, because you don’t have to store as much on SSD.
So, what are you waiting for? Try Uptrace as your next OpenTelemetry backend or check out the cloud demo of Uptrace.
We offer huge thanks to Vladimir Mihailenco for his many contributions to the DevOps ecosystem, which includes not only Uptrace but also the now-officially-supported Redis Client library for Golang, go-redis. To learn more about the fastest and easiest way to get started with the Go Programming Language and Redis, read Go-Redis Is Now an Official Redis Client or visit the GitHub repo. Happy developing!